Top Findings From Our The Secrets of Facebook Post Engagement Report
Top Findings From Our The Secrets of Facebook Post Engagement Report
Multi-location brands cannot rely merely on national-level corporate marketing on social media. They need to be present at the local level. Our previous research found that local store pages on Facebook drive 67 percent greater engagement when brands post unique content from each store versus general non-localized content.
Our most recent report, The Secrets of Facebook Post Engagement, verified that improvements in one Facebook engagement metric tend to influence other metrics. Insights from this report will help multi-location marketers better understand how to get the greatest benefit from their Facebook marketing efforts at the local level.
Here are some of the report’s main takeaways:
- Complete and informative Facebook profiles correlate (0.60) with higher ratings.
- There’s a strong correlation (0.74) between businesses responding to Facebook recommendations (Facebook’s term for reviews) and overall recommendation volume.
- Posts with videos have twice the correlation with engagement as posts with photos.
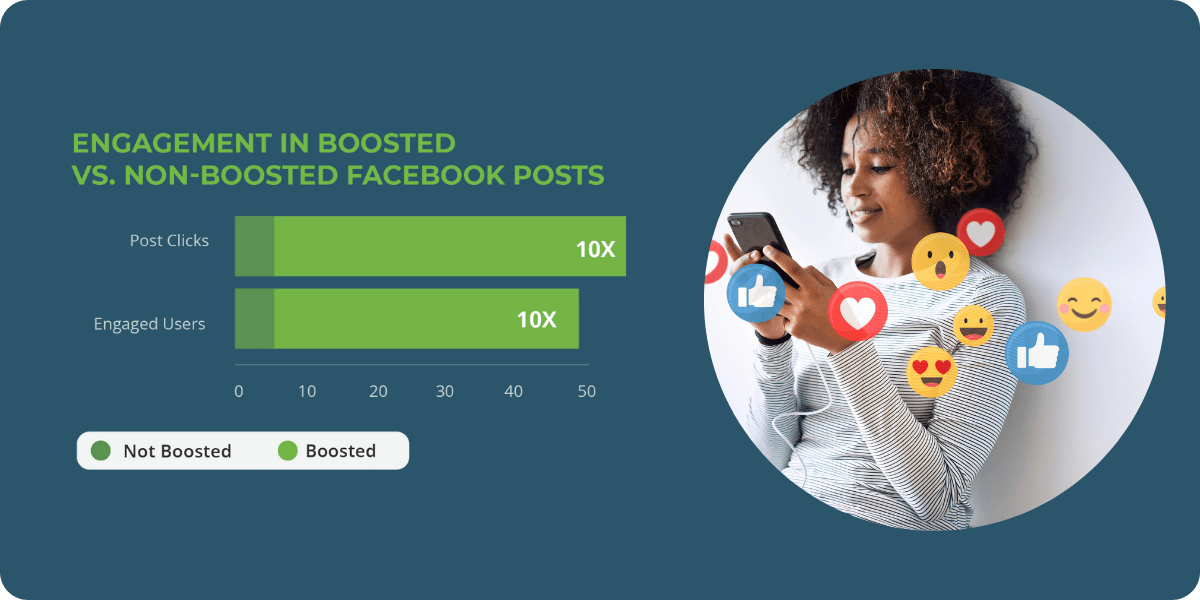
- Boosted posts earn 10x as many clicks as non-boosted posts.
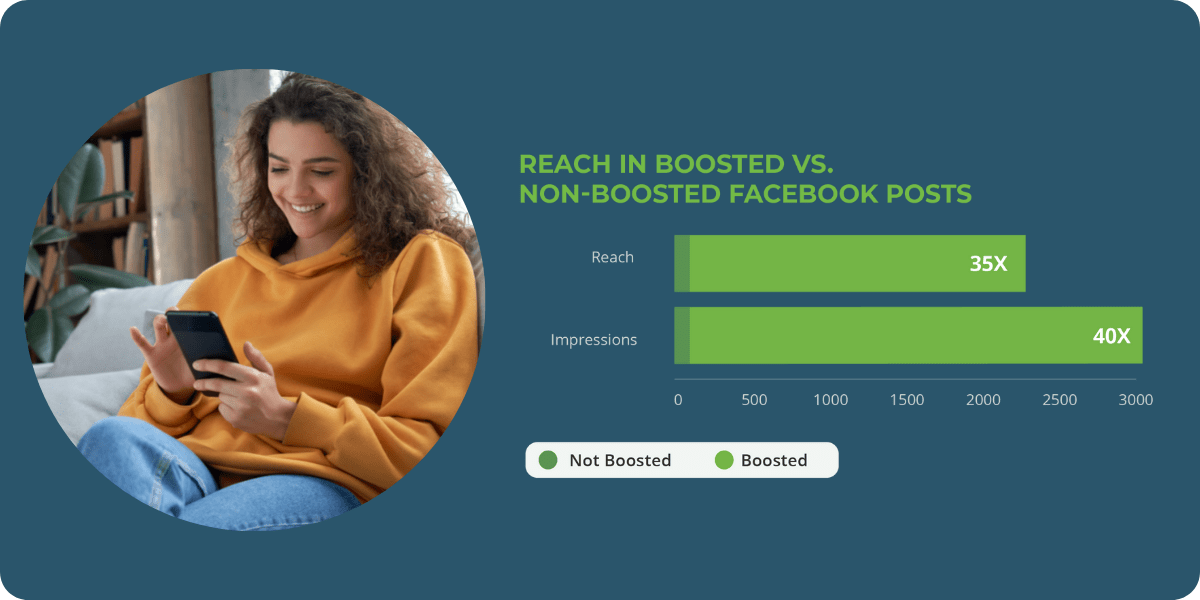
- Boosted posts see 35x the reach and 40x more impressions than non-boosted posts.
We’ll dive more into the data and what it means later in this blog, but for the complete Top Findings From Our Facebook Post Engagement report, click the download button below!
For more information on how we created our report, head to our methodology section.
Our Facebook Correlation Heatmap Explained
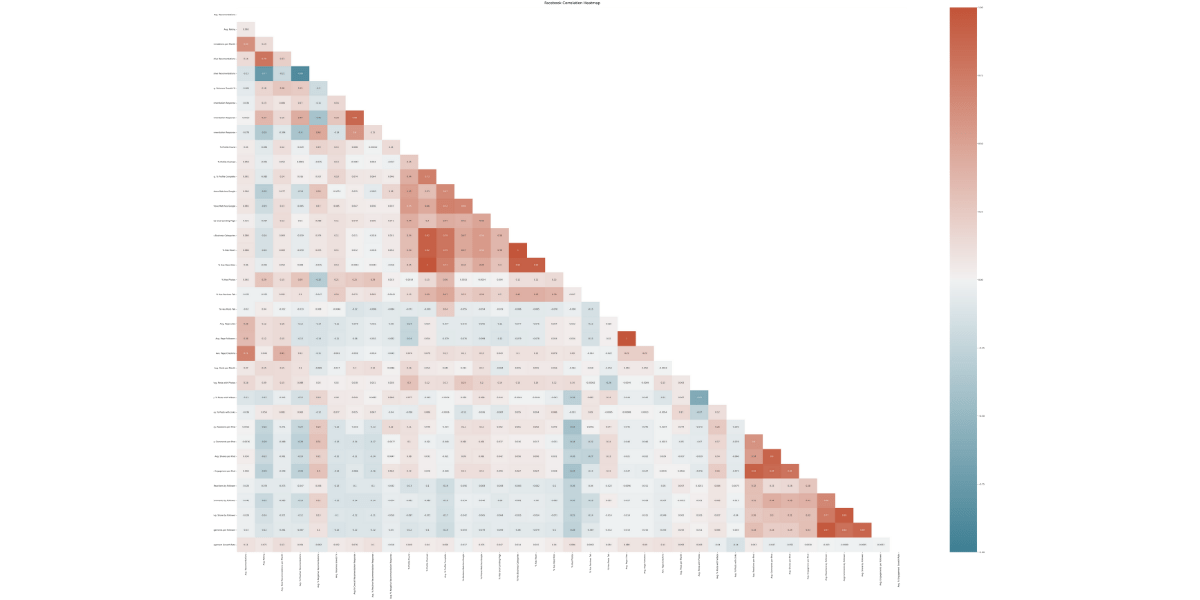
Before diving into the main insights from our The Secrets of Facebook Post Engagement report, we need to explain what a correlation heatmap is. A correlation heatmap is a two-dimensional representation of the relative strength of relationships between sets of variables.
- A positive correlation means that increases in one metric are linked to increases in another; for instance, spending more hours studying positively correlates to higher test scores.
- A negative correlation, on the other hand, means an inverse occurs whereas one metric goes up, the other goes down; presumably, for example, more hours spent playing video games would be negatively correlated with higher test scores.
We created a heatmap of our Facebook metrics from our 2022 Localized Marketing Benchmark Report — which analyzed 230,000 multi-location businesses to establish benchmarks in local search, social, and reputation.
We were able to depict correlations on a scale from -1.00 to +1.00, where 0 means no correlation at all. Negative numbers indicate negative correlations (blue), and positive numbers indicate positive correlations (red). The stronger the correlation, the closer it will approach -1.00 or +1.00 and the darker the color.
Main Insights From Our Facebook Correlation Heatmap
Some of the correlations we discovered through this analysis were expected, others surprising. Here are some of the highlights.
1. Engagement Encourages More of the Same
Reactions, such as clicking the like, love, care, haha, wow, sad, or angry icons on a post, are strongly correlated with comments (0.62) and shares (0.66). This positive correlation means that one type of engagement tends to drive other types. More importantly, engagement affects visibility. The more engagement you receive, the more users will see your post, which increases your brand’s visibility.
2. Consumers Like Complete and Informative Businesses
Profile completeness on Facebook correlates strongly with a business’s average Facebook rating (0.60). It appears that consumers are more likely to recommend a business if its local social profile provides plenty of information about itself, such as contact information, business hours, a description, photos, etc.
3. Review Response Drive More Reviews
Responding to reviews is an integral part of online reputation management for multi-location marketers. Facebook is no different. There’s an especially strong correlation (0.74) between businesses responding to Facebook recommendations (Facebook’s term for reviews) and overall recommendation volume.
Responding to positive and negative recommendations on your Facebook store pages can cause more people to recommend your business over time.
If you need help responding to Facebook comments or messages, download our Multi-Location Marketer’s Guide to Online Reputation Management
4. Videos are Twice as Engaging as Photos
Posts with videos have twice the correlation with engagement as posts with photos (0.28 compared to 0.14). Note that the correlation figures are lower than other metrics we’ve highlighted because photo and video posts together make up the vast majority of the posts we analyzed.
According to our 2022 LMBR findings, some 73 percent of Facebook posts from business pages contain photos, while about 10 percent contain videos. Therefore, there’s a significant opportunity to use videos to improve your engagement rate and outpace your competitors.
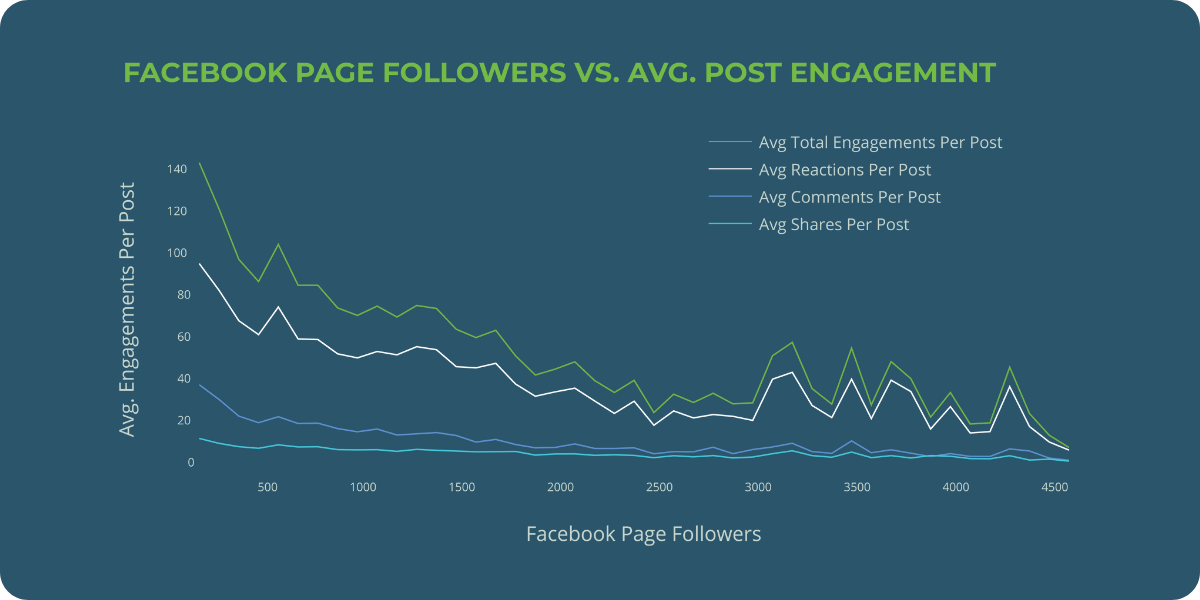
5. Engagement Is Not Linked to Audience Size
Our research revealed that greater audience sizes do not lead to greater levels of engagement. Surprisingly, there’s a negative correlation: engagement as a proportion of audience size declines as follower count grows, as illustrated in the chart below.
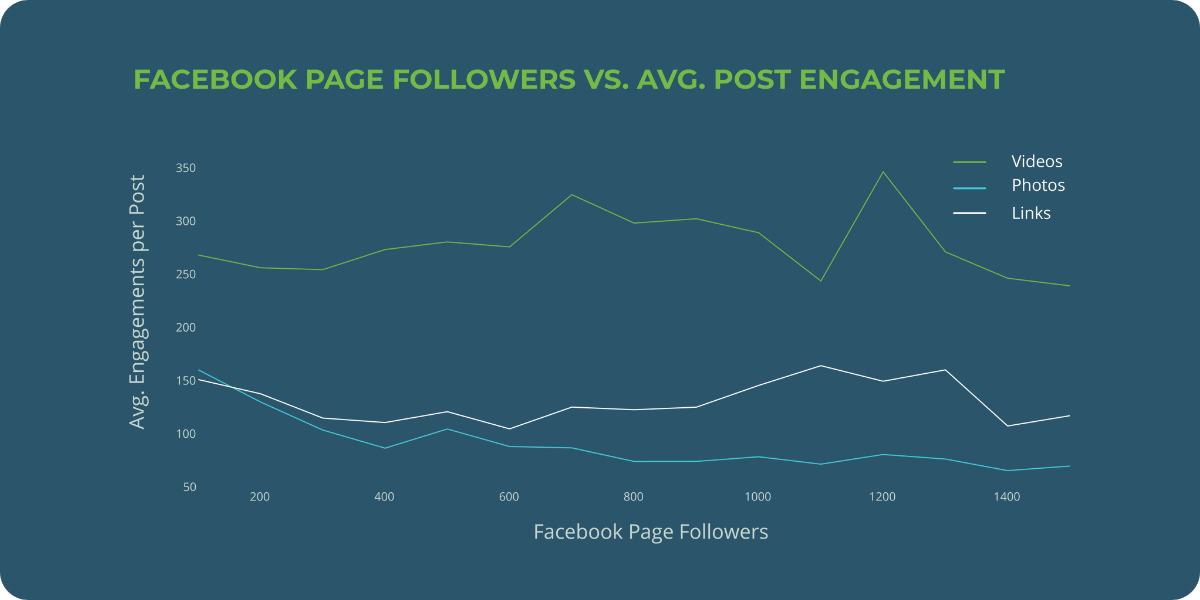
However, there are a few noteworthy caveats to these findings. The average multi-location business, according to our LMBR data, has about 523 followers. Therefore, we isolated post engagement by follower count up to an audience size of 1,500. We also differentiate between posts with videos, photos, and links.
As seen in the image above, video posts outperform photo and link posts by a wide margin. Moreover, as audience size grows, so does engagement with videos to some extent, unlike the other two content types.
This insight suggests that Facebook is granting more reach to organic video content, at least up to a maximum follower count of around 1,500. Beyond an audience of 1,500, the data becomes choppier with no discernible pattern.
The Power of Boosted Posts
Because Facebook limits the amount of organic reach and engagement your posts receive, they’ve allowed companies to boost posts or create Facebook advertisements. For this report, we focused on boosted posts, which is the simplest way to advertise on Facebook.
We examined approximately 22,000 posts from multi-location businesses where we could determine which posts were boosted and which were not. Note, we didn’t differentiate between posts that were boosted for reach or engagement.
We found that boosted posts earn 10x as many clicks and engage 10x as many users as non-boosted posts.
We also found that boosting has an even more significant impact on reach than engagement. Boosted posts see 35x the reach and 40x more impressions than non-boosted posts.
Clearly, one of the best ways for brands to reach and engage larger audiences is by boosting their posts. While there are many benefits to boosting, multi-location brands still need to post organic content, which should form the basis of localized Facebook campaigns.
Tips for Organic Engagement
- Don’t just promote your business; show off your expertise by sharing helpful content
- Establish a brand voice and use it consistently
- Use a variety of CTAs to encourage reactions, comments, shares, and conversions
- Utilize authentic (not overproduced) photos, and short-form video with captions
- Post community-based, local stories, cute/funny posts, and feel-good stories
Tips for Boosted Posts
- At least some posts from each individual business location should be boosted
- Add CTA buttons, such as Book Now, Shop Now, Call Now, to encourage conversions
- Target audiences by geography, age group, gender, and interests
- Allocate budget for experiments, and double down on posts that work well
- Use cross-posting to build engagement on Facebook, Messenger, and Instagram
Now that you understand what goes into creating high-quality boosted and organic content, let’s take a look at the report’s methodology.
Methodology
For our 2022 LMBR, we audited the online presence of approximately 230,000 businesses. We also analyzed a dataset that included 690,000 online profiles, 97 million reviews, 23 million social media posts, and close to six billion total consumer engagements with businesses at the local level. From there, we created a correlation heatmap from all of the categories of Facebook metrics we measured.
Using the Right Social Media Tools
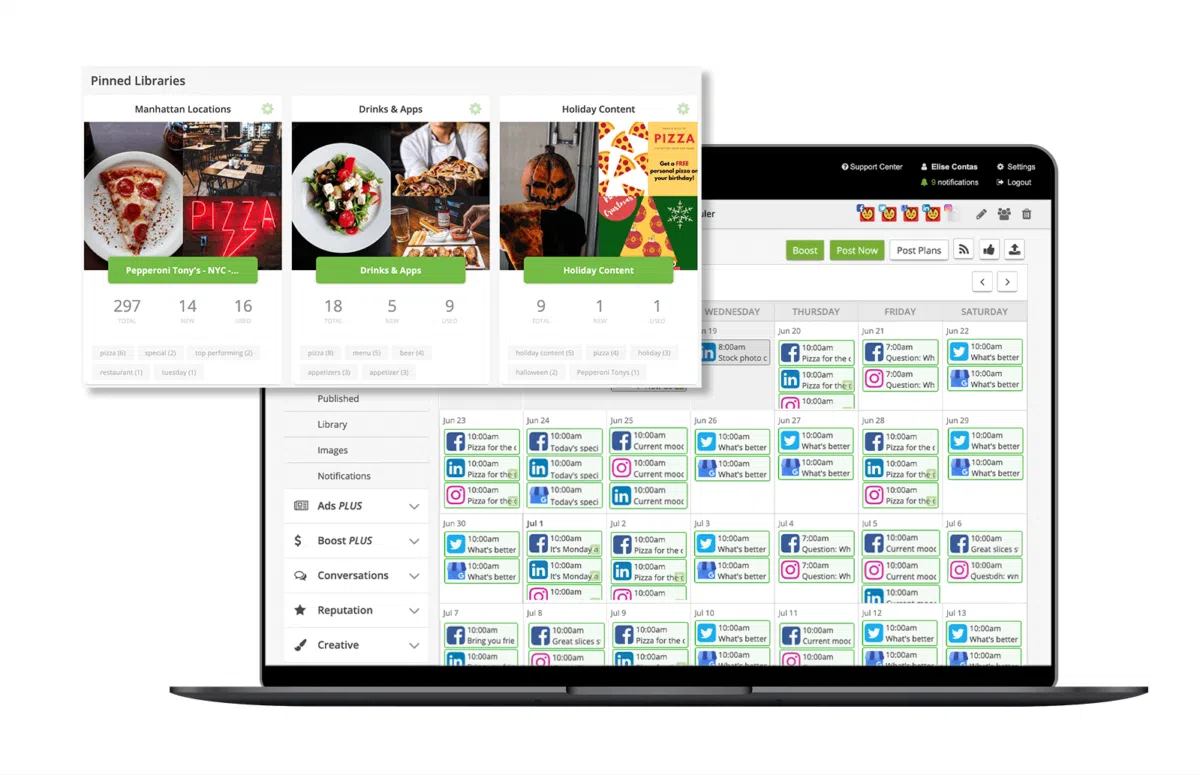
Beyond limiting organic posts’ reach, Facebook also makes it difficult to publish (boosted and non-boosted) posts and ads across your locations. SOCi Social allows you to create, schedule, and manage customizable posts that you can distribute to 100s or 1,000s of locations.
Additionally, if you need to improve your social media advertising capabilities, SOCi Ads and Boost PLUS lets you turn a single ad template into thousands of custom local ads. You can also track and measure ad spend, reach, and engagement across regions and individual locations. These insights allow you the ability to optimize your Facebook ad campaigns for a higher ROI.
It’s time to start improving your brand’s Facebook strategy, and the findings from this report, combined with SOCi’s offerings, can help. Request a demo today to increase your Facebook post’s engagement rate!

